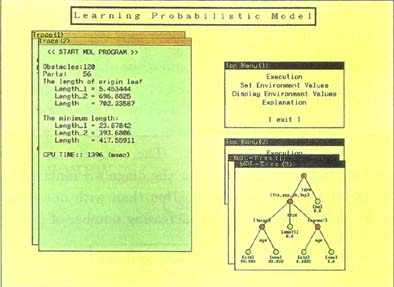
Result of the Learning Function
OUTLINE OF DEMONSTRATION

An example model base for a packet switching device with 70 components
is used for the demonstration. The system first shows the result of the fault
probability estimation by the learning function. Then, it repeats test selection
and execution cycle to pinpoint the faulty component, against a simulated
faulty device model. The process of the diagnosis is shown graphically on
the display which expresses fault probabilities with different color brightness.
The parallel execution is performed on a Multi-PSI machine.
|
Result of the Learning Function |
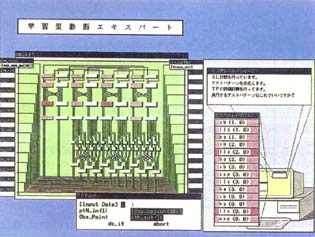 Diagnosis Session |