Demonstration Schedule

Only the Deep Inference Subsystem is demonstrated. The experimental results of the whole
system, which consists of the Deep Inference Subsystem, the Shallow Inference Subsystem and the
plant simulator, is demonstrated using the video tape.

Step1) Occurrence of an unforeseen abnormal plant situation

The case of multiple faults is demonstrated below. The video tape reproduces the scene of the
abnormal plant situation caused by the malfunction of the plant simulator. In this demonstration,
this occurrence is a manual input into the system.
|
performance drop of a boiler-feed-water-pump & stuck close of a circulation-water-control-valve
|
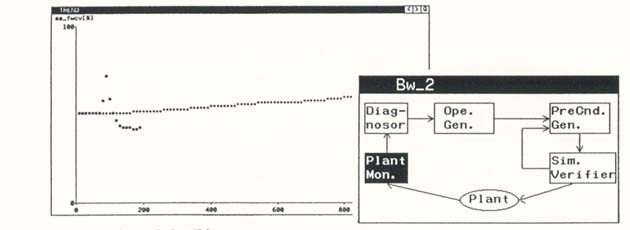
Step2) Detection of the symptoms
The Plant Monitor detects the unallowable deviations between the predicted plant behavior and
the observed one. After that, the Deep Inference Subsystem is activated.
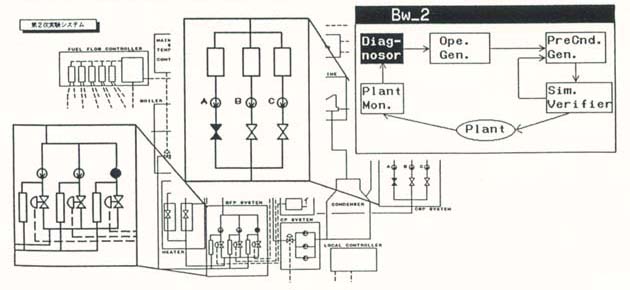
Step3) Activation of the Diagnosor
The Diagnosor calculates the possible disorders for the detected symptoms by using the Qualitative
Causal Model and the symptoms clustering technique. After that, the Diagnosor outputs the plant
operations to stop the malfunctioning devices.
- 21 -


